Understanding Melting Temperature Fundamentals
DNA Melting Process Visualization
At Tm, 50% of DNA duplexes are dissociated. Below Tm, DNA is mostly double-stranded; above Tm, it's mostly single-stranded.
Melting temperature (Tm) is one of the most critical parameters in oligonucleotide design. It represents the temperature at which 50% of double-stranded DNA molecules dissociate into single strands. Understanding Tm is essential for:
- PCR primer design: Setting optimal annealing temperatures (see complete checklist)
- qPCR optimization: Ensuring efficient amplification
- Hybridization assays: Designing probes and capture sequences
- Multiplex PCR: Balancing multiple primer pairs
- CRISPR guide design: Optimizing sgRNA binding
The accuracy of Tm prediction directly impacts experimental success. Inaccurate calculations can lead to failed PCR reactions, non-specific amplification, or inefficient hybridization. Modern Tm calculation methods, particularly the SantaLucia nearest-neighbor method, provide the precision needed for reliable experimental design.
Historically, researchers used simple formulas based on GC content (e.g., Tm = 4°C × GC% + 2°C × AT%). While these approximations work for rough estimates, they ignore sequence context and can produce errors of 5-10°C. The SantaLucia method, developed in the 1990s and continuously refined, accounts for nearest-neighbor interactions, terminal effects, and accurate salt corrections.
Tm Calculator Comparison: OligoPool vs NEB vs IDT vs Sigma
Choosing the right Tm calculator affects experimental success. Here's how our free calculator compares to commercial alternatives from New England Biolabs (NEB), Integrated DNA Technologies (IDT), and Sigma-Aldrich:
| Calculator | Method | Accuracy | Free? | Batch Processing |
|---|---|---|---|---|
| OligoPool.com | SantaLucia 1998 + updates | ±1-2°C* | Yes | Yes |
| NEB Tm Calculator | Nearest-neighbor (polymerase-specific) | Optimized for NEB enzymes | Yes | Limited |
| IDT OligoAnalyzer | Nearest-neighbor (SantaLucia) | Standard NN accuracy | Yes | No |
| Sigma OligoEvaluator | Basic nearest-neighbor | Basic NN (no Mg²⁺ correction) | Yes | No |
| Phusion Tm Calculator | Polymerase-specific | ±2-3°C | Yes | No |
Why Use OligoPool's Tm Calculator
- • SantaLucia 1998 method: The same gold-standard nearest-neighbor thermodynamics used by NEB, IDT, and leading research tools
- • Transparent calculations: Shows ΔH, ΔS values — verify the math yourself, unlike black-box commercial tools
- • Batch processing: Calculate Tm for hundreds of primers simultaneously (NEB/IDT limited to single sequences)
- • No vendor lock-in: Works with any PCR buffer or polymerase (Phusion calculator assumes specific buffer conditions)
- • Complete salt correction: Owczarzy (2004, 2008) models for both monovalent and divalent cation effects
When to use vendor-specific calculators: If you're using NEB's Q5 or Phusion polymerases with their proprietary buffers, the NEB Tm Calculator includes polymerase-specific adjustments that may improve accuracy for those particular systems. Similarly, IDT's OligoAnalyzer is optimized for IDT synthesis conditions. For general PCR with any polymerase, any SantaLucia-based calculator — including ours — provides accurate predictions (±1-2°C for sequences >14 bp).
*Accuracy claim based on SantaLucia (1998) PNAS 95:1460-1465, which reported standard deviation of 1.5°C across 108 oligonucleotide sequences tested experimentally. Accuracy depends on correct buffer composition input and sequence length >14 bp.
Tm Calculation Methods: Technical Comparison
| Method | Accuracy | Considers | Best For |
|---|---|---|---|
| Simple GC% Formula | ±5-10°C error | GC content only | Rough estimates |
| Basic Nearest-Neighbor | ±3-5°C error | Sequence context | General use |
| SantaLucia Method | ±1-2°C error | Sequence context, terminal effects, salt corrections | PCR, qPCR, research |
Our Tm Calculator uses the SantaLucia nearest-neighbor method with updated thermodynamic parameters, ensuring accuracy within 1-2°C of experimental values for most sequences.
Recent Tm Prediction Updates
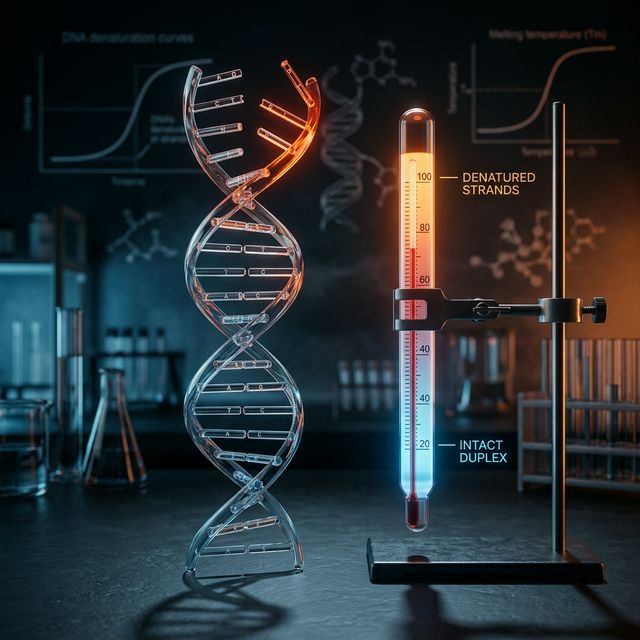
Tm (melting temperature) marks the transition point where 50% of DNA duplexes dissociate into single strands.
Sugimoto et al. (2020): Updated RNA/DNA Hybrid Parameters
The most significant update to nearest-neighbor thermodynamics since SantaLucia 1998 came from Sugimoto's group, who published revised RNA/DNA hybrid duplex parameters. These updated values improve Tm prediction accuracy for:
- Antisense oligonucleotides (ASOs) that form RNA/DNA hybrid duplexes in therapeutic applications
- PCR primers binding to RNA templates in RT-PCR reactions
- CRISPR guide RNAs forming RNA/DNA heteroduplexes with target genomic DNA
Our calculator currently uses the SantaLucia 1998 unified DNA/DNA parameters, which remain a common reference set for standard PCR primer design. RNA/DNA hybrid mode uses Sugimoto's updated parameters when available.
Dec 2024: Bioinformatic Comparison of 7 Primer Design Tools
A December 2024 study published on ResearchGate compared 7 accessible web-based PCR primer design programs, including NCBI Primer-BLAST, Primer3, and Primer3Plus. Key findings relevant to Tm calculation:
- All tools using SantaLucia nearest-neighbor parameters produced comparable Tm values for identical input sequences and conditions
- Tm discrepancies between tools were primarily caused by different default salt concentrations and oligo concentration assumptions, not algorithmic differences
- NCBI Primer-BLAST showed 91% success rate in finding suitable primers compared to 45% for Primer3Plus, due to its built-in specificity checking — not Tm accuracy differences
Source: ResearchGate bioinformatic comparison study (Dec 2024); Siswa et al. (2022) NCBI vs Primer3Plus comparison.
Owczarzy vs SantaLucia: Salt Correction Validation
Recent validation studies confirm that Owczarzy's (2004, 2008) salt correction formulas provide superior accuracy over the original SantaLucia salt correction, particularly in:
- High Mg²⁺ conditions (1.5–5 mM): Owczarzy 2008 reduces prediction error by ~1°C compared to the basic SantaLucia correction
- Mixed monovalent/divalent conditions: Critical for PCR buffers containing both KCl and MgCl₂
- Low salt conditions (<50 mM Na⁺): Where the SantaLucia correction can underestimate Tm by 2–3°C
Our Tm Calculator uses the Owczarzy salt correction model by default. A key parameter is the Mg²⁺/Mon⁺ ratio: when [Mg²⁺]⁰·⁵/[Mon⁺] < 0.22 M⁻¹ᐟ², monovalent ions dominate stabilization (use Owczarzy 2004 Na⁺ correction). Above this threshold, Mg²⁺ effects dominate (use Owczarzy 2008 Mg²⁺ model). This ratio-based switching is critical for accurate predictions in standard PCR buffers containing both KCl and MgCl₂.
Tm Calculation Checks Before You Set Annealing Temperature
Before using a calculated Tm to set annealing temperature, confirm the assumptions behind the number. Each check includes a numerical example showing the potential error:
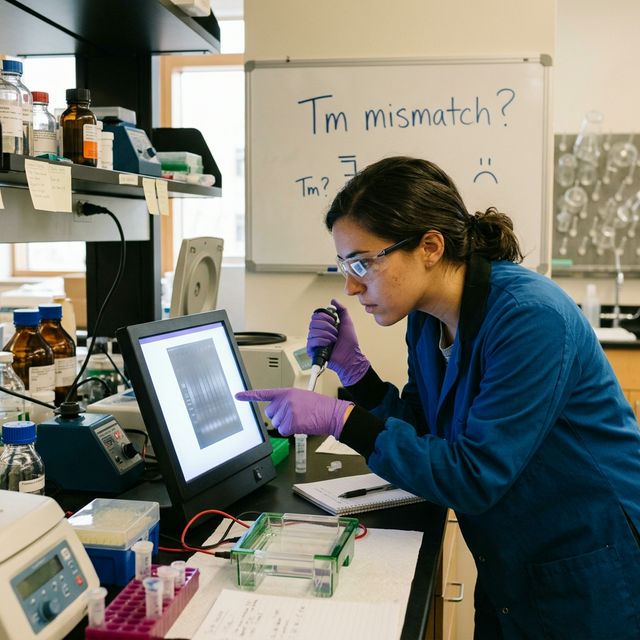
Incorrect Tm calculations frequently lead to non-specific amplification bands visible on agarose gels.
Check 1: Avoid Wallace Rule estimates for sequences >14 bp
Problem: The Wallace Rule (Tm = 2(A+T) + 4(G+C)) was originally developed for short oligonucleotides of 14-20 nucleotides in length. Using it for sequences outside this range — especially longer sequences — introduces significant error because the rule does not account for nearest-neighbor stacking interactions.
Sequence: ATCGATCGATCGATCGATCG (20-mer, 50% GC)
Wallace Rule estimate: Tm = 2(10) + 4(10) = 60°C
Nearest-neighbor result: Tm ≈ 52.8°C (at 50 mM Na⁺, 250 nM oligo)
Error: ~7°C overestimate — enough to cause non-specific amplification
Solution: Always use the nearest-neighbor method for sequences >14 bp. Our calculator automatically applies the appropriate method based on sequence length.
Check 2: Match Na⁺ concentration to the reaction buffer
Problem: Forgetting to set salt concentration (or leaving it at 0) causes severe Tm underestimation. Cations stabilize the DNA duplex by neutralizing phosphate backbone charges.
Sequence: GCTAGCTAGCTAGCTAG (17-mer, 59% GC)
At 0 mM Na⁺: Tm ≈ 28°C (mathematically invalid)
At 50 mM Na⁺: Tm ≈ 56°C (physiologically relevant)
Error: ~28°C underestimate — renders the prediction useless
Solution: Always match salt concentrations to your actual buffer conditions. Standard PCR buffers contain 50 mM KCl = ~50 mM monovalent cation equivalent. See our salt concentration table above.
Check 3: Account for DMSO when it is present
Problem: DMSO is commonly added to PCR reactions for GC-rich templates, but many researchers forget to account for its effect on Tm.
Sequence: GCGCGCGCGCGCGCGC (16-mer, 100% GC)
Without DMSO correction: Tm ≈ 68°C
With 5% DMSO: Tm ≈ 62°C (Tm drops ~0.6°C per 1% DMSO)
Error: ~6°C overestimate — leads to failed amplification of GC-rich targets
Solution: If using DMSO or betaine enhancers, reduce calculated Tm by ~0.6-0.75°C per 1% DMSO. At 5% DMSO, that's approximately 3-3.75°C reduction. Our calculator's DMSO adjustment field handles this automatically.
Check 4: Keep forward and reverse primer Tm values close
Problem: Designing forward and reverse primers without comparing their Tm values. Large Tm mismatches cause preferential amplification of one strand, reducing yield.
Forward: ATCGATCGATCGATCG (50% GC, Tm ≈ 49°C)
Reverse: GCGCGCGCGCGCGCGCGCGC (100% GC, Tm ≈ 72°C)
ΔTm = 23°C — no single annealing temperature will work for both
Target: Keep forward/reverse Tm within ±2°C of each other
Solution: Use batch mode to calculate Tm for both primers simultaneously. Adjust primer length or position to minimize Tm difference. Use our Primer Analyzer for comprehensive primer pair validation.
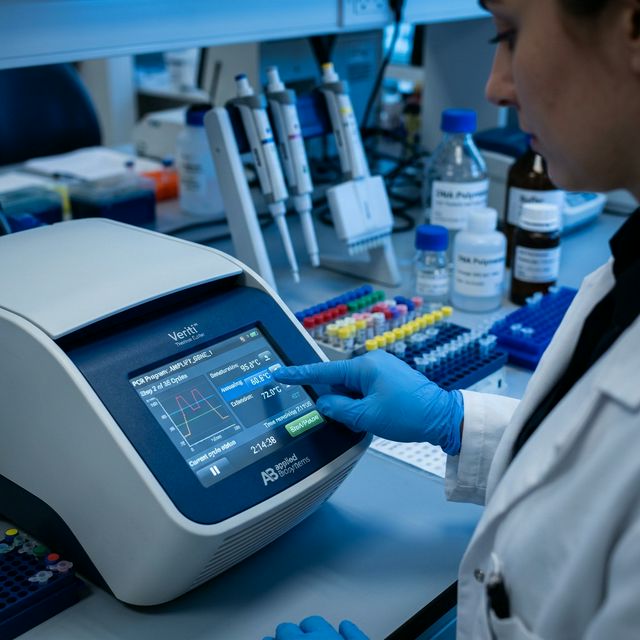
Using the Tm Calculator
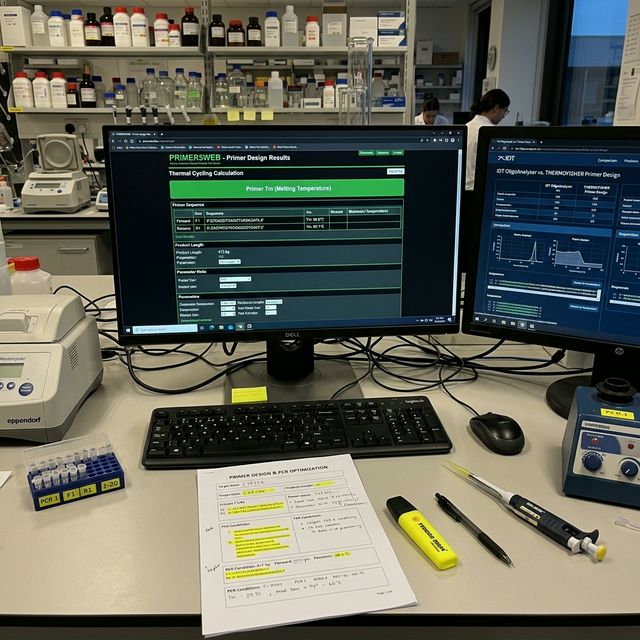
A well-configured bioinformatics workstation enables efficient primer design with real-time Tm comparison.
Open the Tm Calculator
Navigate to the Tm Calculator. The tool supports both single sequence and batch processing modes. For this tutorial, we'll start with single sequence mode, which is ideal for PCR primer design and individual oligonucleotide analysis.
Enter Your Sequence
Paste your oligonucleotide sequence into the input field. The sequence can be:
- DNA sequences: A, T, C, G (case-insensitive)
- RNA sequences: A, U, C, G (case-insensitive)
- With or without spaces, numbers, or line breaks
Select the sequence type (DNA or RNA) from the dropdown menu. The calculator will automatically use appropriate thermodynamic parameters for each nucleic acid type.
Set Salt Concentrations
Salt concentrations significantly affect Tm values. Match these to your actual experimental conditions. The table below shows standard conditions for common applications:
| Application | Na⁺ (mM) | Mg²⁺ (mM) | Notes |
|---|---|---|---|
| Standard PCR | 50 | 1.5-2.5 | Most common conditions |
| High-Fidelity PCR | 20-30 | 1-2 | Lower salt for accuracy |
| qPCR | 50-100 | 3-5 | Higher Mg²⁺ for SYBR Green |
| Hybridization | 100-500 | 0-1 | High salt for stability |
Important: If your buffer contains both Na⁺ and K⁺, use the total monovalent cation concentration. The calculator treats Na⁺ and K⁺ equivalently. Always check your PCR buffer composition or manufacturer's specifications for accurate values.
Set Oligonucleotide Concentration
Oligonucleotide concentration affects Tm, especially for self-complementary sequences. Higher concentrations increase Tm slightly due to mass action effects. Typical values:
- PCR primers: 0.1-0.5 µM (0.25 µM is standard)
- qPCR primers: 0.1-0.3 µM (lower for better efficiency)
- Probes: 0.05-0.2 µM
- Hybridization: 0.01-1 µM (depends on application)
Concentration Effect on Tm
| Concentration Change | Typical Tm Change | Example Scenario | Practical Impact |
|---|---|---|---|
| 0.1 µM → 1.0 µM (10×) | +2 to +3°C | Primer optimization tests | Noticeable but manageable |
| 0.25 µM → 0.5 µM (2×) | +0.5 to +1°C | Normal variation | Minimal, usually negligible |
| 0.01 µM → 0.1 µM (10×) | +2 to +3°C | Low-input to standard qPCR | Recalculate Tm |
Concentration effect: ΔTm = R × ln(C₂/C₁) / ΔS, where typical ΔS ≈ -22 cal/(mol·K) for DNA duplexes. Effect is larger for self-complementary sequences (hairpins, palindromes).
For most applications, 0.25 µM is a good default value. However, if you're designing primers for specific protocols (e.g., low-input qPCR), adjust accordingly. Need to calculate primer concentration from mass? Use our Molecular Weight Calculator to convert between mass, moles, and concentration.
Add DMSO When Needed
If your PCR reaction includes DMSO (common for GC-rich templates), enter the percentage. DMSO reduces Tm by approximately 0.6-0.75°C per 1% concentration (Chester & Marshak, 1993, Anal Biochem 209:284-290):
- 5% DMSO: Tm reduction ~3-3.75°C
- 10% DMSO: Tm reduction ~6-7.5°C
Common uses for DMSO:
- GC-rich templates (>60% GC)
- Difficult-to-amplify sequences
- Reducing secondary structure formation
Formamide has a similar effect (0.6-0.7°C per 1%). If using formamide, you can approximate its effect using the DMSO field or calculate manually.
Calculate and Interpret Results
Click"Calculate Tm" to get results. The calculator displays:
- Tm value: The calculated melting temperature in °C
- Thermodynamic parameters: ΔH (enthalpy) and ΔS (entropy)
- GC content: Percentage of G and C bases
- Sequence length: Number of nucleotides
For PCR Primer Design:
- Optimal Tm range: 55-65°C (ideal: 58-62°C)
- Forward and reverse primers should have Tm within 5°C
- Annealing temperature = (lower Tm - 3 to 5°C)
Troubleshooting:
- Tm too low (<50°C): Increase primer length or GC content
- Tm too high (>70°C): Shorten primer or reduce GC content
- Large Tm difference: Redesign one primer to match the other
Calculate Annealing Temperature from Tm
After calculating Tm, determine your PCR annealing temperature. The annealing temperature is typically 3-5°C below the lower primer Tm to ensure primer-template binding while minimizing non-specific annealing.
| PCR context | Formula | Use when |
|---|---|---|
| Standard PCR | Tanneal = Tm(lower) - 5°C | Use the lower Tm of the primer pair |
| qPCR or multiplex PCR | Tanneal = Tm(lower) - 3°C | Higher annealing temperature improves specificity |
| Difficult templates | 0.3 × Tm(primer) + 0.7 × Tm(product) - 25°C | GC-rich or structured templates may need touchdown PCR |
Primer Pair Optimization Table
| Primer Tm Difference | Recommended Tanneal | Expected Result | Action Needed |
|---|---|---|---|
| <2°C (Ideal) | Tm(avg) - 5°C | Optimal amplification | None |
| 2-5°C (Acceptable) | Tm(lower) - 5°C | Good amplification | Monitor specificity |
| 5-8°C (Marginal) | Tm(lower) - 3°C | Primer bias possible | Consider touchdown PCR |
| >8°C (Poor) | Gradient optimization | Inefficient or failed PCR | Redesign primers |
Example calculation: If Forward primer Tm = 58°C and Reverse primer Tm = 62°C, use Tanneal = 58°C - 5°C = 53°C for standard PCR. The 4°C difference is acceptable, but monitor for potential bias toward the lower-Tm primer.
DNA Melting Temperature Formula: SantaLucia Calculation Method
The accurate formula for calculating DNA melting temperature (Tm) uses the SantaLucia nearest-neighbor thermodynamic method. This is the same formula implemented in our free Tm calculator:
SantaLucia Tm Calculation Formula
Tm = ΔH° / (ΔS° + R × ln(Ct/4)) - 273.15 + Salt Correction
ΔH° = Sum of nearest-neighbor enthalpy changes (kcal/mol)
ΔS° = Sum of nearest-neighbor entropy changes (cal/mol·K)
R = Gas constant (1.987 cal/mol·K)
Ct = Total oligonucleotide concentration (M)
[Na⁺] = Sodium ion concentration (M)
273.15 = Kelvin to Celsius conversion
Salt correction: historically 16.6 × log₁₀[Na⁺] (Schildkraut-Lifson 1965), superseded by Owczarzy et al. (2004, 2008) for oligonucleotides. Our calculator uses the Owczarzy correction by default for optimal accuracy.
How to Calculate Tm Manually
- 1. Calculate ΔH° and ΔS°: Sum nearest-neighbor thermodynamic parameters for all base pair steps (e.g., AA/TT, AT/TA, etc.) plus terminal corrections
- 2. Apply salt correction: Use the Owczarzy (2004/2008) correction model for oligonucleotides. The classic 16.6 × log10[Na⁺] formula (Schildkraut-Lifson) is less accurate for short oligos. Owczarzy provides sequence-dependent corrections for both Na⁺ and Mg²⁺.
- 3. Apply concentration term: Include R × ln(Ct/4) for oligonucleotide concentration effects
- 4. Convert to Celsius: Subtract 273.15 to convert from Kelvin
Manual calculation requires nearest-neighbor parameter tables (10 DNA-DNA pairs). Our calculator does this instantly with verified thermodynamic values.
Advanced Topics: Understanding the SantaLucia Method
The SantaLucia nearest-neighbor method, developed in the 1990s and continuously refined, is the preferred method for sequence-aware Tm calculation. Unlike simple GC% formulas, this method accounts for:
- Sequence context: Each base pair's stability depends on its neighbors
- Terminal effects: Ends of duplexes have different stability
- Thermodynamic parameters: Experimentally determined enthalpy (ΔH) and entropy (ΔS) values
- Salt corrections: Accurate adjustment for ionic strength
The 10 nearest-neighbor base pair combinations used in the calculation:
AA/TT · AT/TA · TA/AT · CA/GT · GT/CA · CT/GA · GA/CT · CG/GC · GC/CG · GG/CC
Each pair has unique ΔH° and ΔS° values from experimental measurements (SantaLucia, 1998)
Our calculator uses updated thermodynamic parameters from recent literature, ensuring accuracy within 1-2°C of experimental values for most sequences. The SantaLucia method considers all 10 possible nearest-neighbor pairs (AA/TT, AT/TA, TA/AT, CA/GT, GT/CA, CT/GA, GA/CT, CG/GC, GC/CG, GG/CC) with their specific thermodynamic values.
Recent improvements to the method include better terminal mismatch corrections and updated parameters for modified nucleotides. These refinements make the calculator suitable for modern applications including qPCR, multiplex PCR, and high-throughput screening.
Practical Applications and Examples
Standard PCR Primer
Sequence: ATCGATCGATCGATCGATCG (20 bp, 50% GC)
Conditions: Na⁺ 50 mM, Mg²⁺ 1.5 mM, [oligo] 0.25 µM, no DMSO
Result: Tm ≈ 58-60°C (ideal for PCR)
Recommendation: Use annealing temperature of 55-57°C. This primer is well-suited for standard PCR applications. Pair it with a reverse primer of similar Tm (within 5°C) for optimal results.
GC-Rich Primer with DMSO
Sequence: GCGCGCGCGCGCGCGCGCGC (20 bp, 100% GC)
Conditions: Na⁺ 50 mM, Mg²⁺ 1.5 mM, [oligo] 0.25 µM, 10% DMSO
Result: Tm ≈ 75-80°C (without DMSO), reduced to ~68-73°C with 10% DMSO (~6-7.5°C reduction per Chester & Marshak, 1993)
Recommendation: Use annealing temperature of 65-68°C, or redesign primer to reduce GC content. GC-rich primers can form stable secondary structures; DMSO helps reduce these structures and improve amplification efficiency.
qPCR Probe
Sequence: ATATATATATATATATATAT (20 bp, 0% GC)
Conditions: Na⁺ 100 mM, Mg²⁺ 3 mM, [oligo] 0.1 µM, no DMSO
Result: Tm ≈ 45-50°C (too low for most applications)
Recommendation: Increase length to 25-30 bp or add GC content to reach 55-60°C. AT-rich sequences have low Tm values and may not provide sufficient specificity for qPCR applications. Use our GC Content Analyzer to optimize composition and Oligo Properties Calculator for comprehensive analysis including extinction coefficient and molecular weight.
Factors Affecting Melting Temperature
Multiple factors influence Tm values. Understanding these factors helps you optimize oligonucleotide design and experimental conditions:
Factors Influencing Tm Values
Multiple factors influence Tm: sequence properties (GC content, length), solution conditions (salt, concentration), and additives (DMSO).
Sequence Factors
- • GC content: Higher GC% increases Tm
- • Length: Longer sequences have higher Tm
- • Sequence context: Nearest-neighbor interactions matter
- • Terminal bases: Ends affect stability
Solution Factors
- • Salt concentration: Higher salt increases Tm
- • Oligo concentration: Higher concentration increases Tm
- • pH: Affects base pairing stability
- • Denaturants: DMSO/formamide reduce Tm
The SantaLucia method accounts for all these factors, providing accurate predictions across a wide range of conditions. Always match calculator parameters to your actual experimental setup for best results.
Final Setup Checks Before You Trust the Tm Result
Check 1: Confirm salt concentrations
Using default values without checking your actual buffer composition leads to inaccurate Tm predictions.
Solution: Always check your PCR buffer or manufacturer's specifications. Different buffers have varying salt concentrations, and these significantly affect Tm.
Check 2: Compare primer-pair Tm values
Using primers with Tm differences greater than 5°C can lead to inefficient amplification or primer bias.
Solution: Design primers with similar Tm values. If one primer has a significantly different Tm, redesign it to match the other. Use our PCR Primer Validation Checklist and Secondary Structure Predictor to validate redesigned primers for hairpins and dimers.
Check 3: Include DMSO when the protocol uses it
Forgetting to include DMSO percentage when it's present in the reaction leads to overestimated Tm and incorrect annealing temperatures.
Solution: Always include DMSO percentage in calculations if your protocol uses it. Even 5% DMSO can reduce Tm by 3-3.5°C, which significantly affects annealing temperature selection.
Check 4: Use nearest-neighbor calculations instead of simple GC% formulas
Relying on outdated GC% formulas instead of the SantaLucia method introduces significant errors.
Solution: Use our Tm Calculator which implements the SantaLucia method. This ensures accuracy within 1-2°C of experimental values.